
How to Make a Phylogenetic Tree (Step by Step)
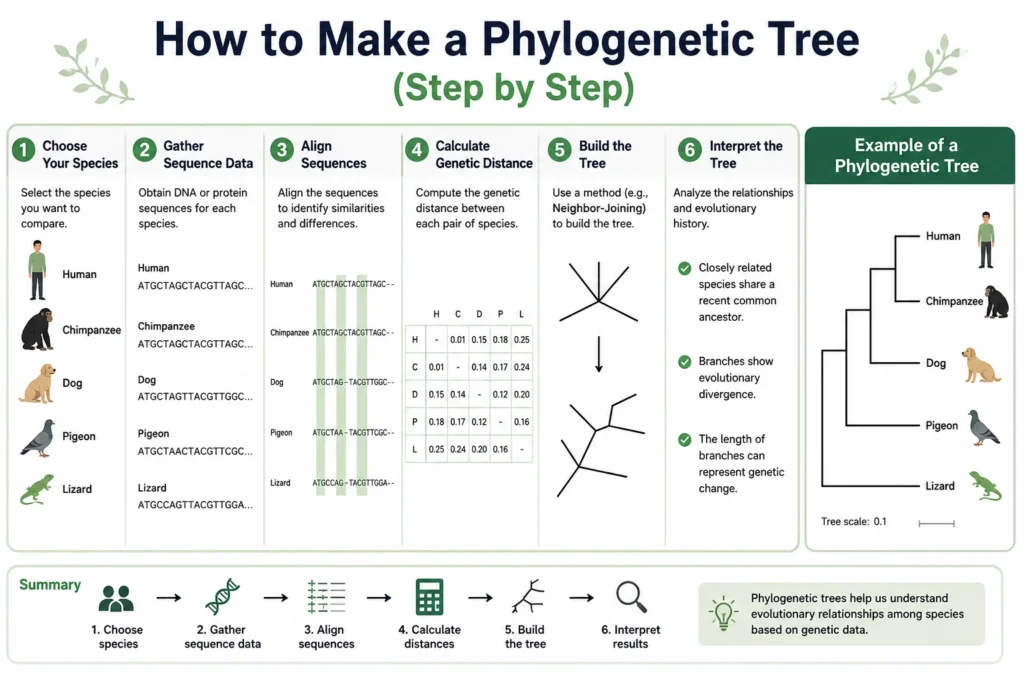
If you’ve ever stared at a blank canvas trying to figure out how species, genes, or strains relate to each other, you already know the hard part isn’t the drawing. It’s deciding what the tree should actually say. A phylogenetic tree maker can handle the branches and labels for you, but the tree is only as good as the data and method behind it.
This guide walks through the real process biologists use to build a phylogenetic tree, then shows you how to do it quickly with a free online tool, no command line required.
What Is a Phylogenetic Tree, Exactly?
A phylogenetic tree is a branching diagram that shows how species, genes, or individual strains are related through shared ancestry. Each tip on the tree represents a taxon (a species, gene, or sample), each internal point where branches split is called a node, and the pattern of branching is the tree’s topology.
It’s worth separating two terms people often mix up:
- Cladogram: shows only the branching pattern, based on shared characteristics. No timing or distance information.
- Phylogenetic tree: can include branch lengths that represent the amount of evolutionary change or time between splits.
Both are built the same general way. The difference shows up in how the final diagram is interpreted.
Step 1: Decide What Kind of Data You’re Working With
Every tree starts with one of two data types:
Trait-based (morphological) data. You compare physical characteristics across organisms, present or absent, and cluster species with the most shared traits. This works well for classroom exercises and doesn’t require sequencing.
Sequence-based (molecular) data. You compare DNA, RNA, or protein sequences. This is the standard in research because sequence data is cheap to obtain and carries more information than physical traits alone. Related species that share a recent common ancestor will still show similar DNA, even after their outward appearance diverges.
If you’re building a tree for a class project, trait data is usually enough. If you’re working with real specimens or published sequences, go molecular.
Step 2: Align Your Sequences (If Using Molecular Data)
Sequences have to be aligned before you can compare them, meaning gaps and matches are lined up so you’re comparing the same position across every organism. Skip this step and your tree will reflect alignment noise instead of real relationships.
Free alignment tools like Clustal Omega or MUSCLE handle this automatically. You paste in your sequences, usually pulled from a database like NCBI GenBank, and the tool returns an aligned file you can feed into a tree builder.
A practical tip from bioinformatics workflows: when pulling sequences from a BLAST search, don’t just grab the closest matches. Include a few more distant sequences as outgroups. Without an outgroup, there’s no way to tell which direction the evolutionary changes actually ran.
Step 3: Choose a Tree-Building Method
This is where most confusion happens, because “phylogenetic tree maker” tools often let you pick a method without explaining what it does. Here’s the short version of the main approaches:
- Neighbor-joining: groups sequences by how many differences they have. Fast, distance-based, and good for a first-pass tree.
- UPGMA: similar distance-based clustering, but assumes a constant mutation rate across all branches. Simple, but less accurate if some lineages evolved faster than others.
- Maximum parsimony: builds the tree that requires the fewest total evolutionary changes to explain the data. Favors the simplest explanation.
- Maximum likelihood / Bayesian inference: statistically models the probability of different tree shapes given the data. More computationally demanding, generally the most accurate for research-grade trees.
For a homework assignment or a quick visual, neighbor-joining or UPGMA is plenty. For a paper or presentation that needs to hold up to scrutiny, maximum likelihood is the standard.
Step 4: Build the Tree with a Maker Tool
Once you know your data and method, building the actual diagram is the easy part. Most free phylogenetic tree makers fall into two categories:
Diagram-style makers (Creately, EdrawMax, Cloudairy, punnettsquare.org) Let you paste a species list, a character matrix, or a Newick-format string, then generate a clean, exportable tree. These are built for speed: drag organisms onto branches, label nodes, and export as PNG, SVG, or PDF for a report or slide deck. They’re a good fit if you already know your tree’s structure or if trait-based UPGMA clustering is enough for your purposes.
Research-grade tools (iTOL, Geneious, and MEGA) are built for annotating and manipulating trees generated from real alignment and statistical output. These support larger datasets, multiple annotation layers, and formats that plug into other bioinformatics software. iTOL alone has processed phylogenetic and other trees from more than 70,000 individual researchers, which gives a sense of how standard it’s become in published research.
If you’re a student or teacher building trees for coursework, a diagram-style maker will save you time without sacrificing accuracy for the assignment. If you’re publishing or presenting original research, a research-grade tool is worth the steeper learning curve.
Step 5: Read and Check Your Tree
Before you call it done, read the tree the same way a reviewer would:
- Start at the root and work outward. Branches closer to the root split earlier; branches near the tips represent more recent divergence.
- Check that your outgroup sits outside the main cluster. If it doesn’t, something’s off with either your data or your method.
- Look at branch support values if your tool provides them (often shown as percentages at each node). Low support means that particular branching pattern isn’t well backed by the data, even if the overall tree looks clean.
A tree that looks tidy isn’t automatically a tree that’s correct. It’s worth a second pass before you export it.
Common Mistakes to Avoid
Comparing the wrong sequences. Make sure every sequence you’re aligning is the same gene or region across all species. Comparing different genes will give you a tree that looks fine but means nothing.
Skipping the outgroup. Without one, you can build a tree, but you can’t tell which end represents the ancestral state.
Using too few sequences. More data generally means a more accurate tree, within reason. A tree built from two or three sequences per species tells you very little.
Treating a cladogram like a timeline. Unless your tool explicitly calculates branch lengths from a molecular clock, don’t read distances between branch points as elapsed time.