Food Web Maker: Build an Accurate Ecosystem Diagram in Minutes
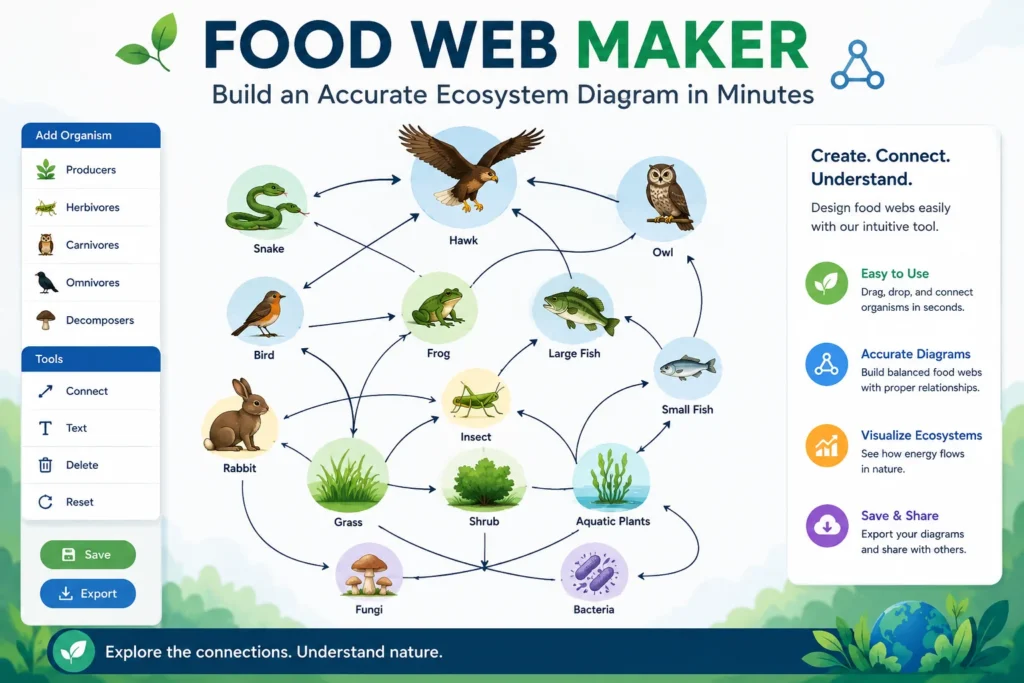
Drawing a food web by hand usually starts fine and falls apart around the eighth arrow. You’ve got grass feeding grasshoppers, grasshoppers feeding frogs, frogs feeding snakes, and then someone points out the hawk also eats the frog and the snake, and now your neat diagram looks like a plate of spaghetti. That’s normal. Real ecosystems are tangled, and a good food web maker exists precisely to keep that tangle readable.
This guide covers what a food web actually is, how to build one step by step, the mistakes that trip up most students and teachers, and what to look for in a food web maker tool.
What Is a Food Web, Exactly?
A food web is every food chain in an ecosystem, layered on top of each other into one connected map. <cite index=”12-1″> ach living thing in an ecosystem belongs to multiple food chains, and all of the interconnected, overlapping chains together make up the web</cite>. That’s the key difference from a food chain: a chain is one path (grass → rabbit → fox), while a web shows every path at once.
Organisms in a food web fall into trophic levels. <cite index=”11-1″>Producers occupy the first level, primary consumers the second, secondary consumers the third, and tertiary consumers the fourth</cite>. Producers, like grass or algae, make their own food from sunlight. Everything above them eats something else to survive, and decomposers at the bottom of the cycle break down what’s left.
Arrows in a food web point from prey to predator, since that’s <cite index=”11-1″>the direction energy flows through the feeding process</cite>. Get that backwards, and the whole diagram reads wrong, even if every species is correct.
What a Good Food Web Maker Actually Needs
Not every diagramming tool handles food webs well. General-purpose flowchart software makes you build every arrow, label, and box from scratch, which is fine for a simple project and painful for a 15-species ecosystem. Look for a tool that offers:
- Pre-built organism sets by biome. Ocean, forest, desert, tundra, and grassland ecosystems each need different species. A tool with ready-made sets saves you from hunting down icons one at a time.
- Trophic-level color coding. When producers, primary consumers, secondary consumers, and decomposers each get a distinct color, students can spot the structure of the web at a glance instead of tracing every arrow.
- Drag-and-drop arrows that don’t cross-wire themselves. Once you hit 10+ organisms, arrows overlap fast. A tool that lets you reroute or curve connections keeps the diagram legible.
- Export options that match how you’ll use it. PNG or JPEG for slides, PDF for printed worksheets, and SVG if it needs to scale for a poster.
- A free tier that doesn’t gate the basics. Plenty of food web makers let you build and export for free, then charge for team collaboration or watermark removal. That’s a fair trade; a paywall on the core diagram isn’t.
How to Build a Food Web Step by Step
1. Pick the ecosystem. Ocean, rainforest, tundra, and backyard garden all work, but pick one you can actually research. A vague “forest” ecosystem is harder to source than “temperate deciduous forest.”
2. List every organism first, before drawing anything. Separate them into producers, primary consumers, secondary consumers, tertiary consumers, and decomposers. This step alone prevents half the errors people make later, because it forces you to place each species correctly before it’s tangled up in arrows.
3. Draw the simple chains first. Start with one obvious path, like phytoplankton → krill → fish → seal. Get two or three of these down before you try to connect them.
4. Layer in the overlaps. Now go back and ask: what else does each organism eat, and what else eats it? A fish rarely eats just one thing, and it’s rarely eaten by only one predator. This is where a food chain turns into an actual web.
5. Add decomposers last. Bacteria and fungi break down dead organisms from every trophic level, so they usually connect back to nearly everything in the diagram. Adding them at the end keeps the earlier steps from getting cluttered.
6. Check every arrow direction. Arrows point toward the predator, not the prey. This is the single most common fix needed on a first draft.
Common Mistakes to Avoid
Treating a food chain like a finished food web. A single line of arrows from grass to hawk is a food chain, not a web. If nothing branches or reconnects, the diagram is incomplete.
Skipping decomposers. Bacteria and fungi rarely make it into a first draft, but they’re the ones actually recycling nutrients back into the system. Leave them out and the energy flow has nowhere to go.
Forcing every organism into one trophic level. Some species eat at more than one level. A bear eating berries and salmon in the same season sits at two trophic levels at once, and that’s accurate, not messy. Don’t flatten it for the sake of a tidier chart.
Reversing arrow direction. Worth repeating: arrows point from what’s eaten to what eats it, matching the direction energy moves through the system.
Overcrowding one diagram. Twenty-five species on one page usually means nobody can read it. If the ecosystem is that complex, split it into a main web plus one or two zoomed-in sections.
Choosing Between a Manual Diagram and an AI-Generated One
Some newer food web makers let you type a description of an ecosystem and get a draft diagram back automatically, which you then edit by hand. That’s genuinely useful for a first draft or for teachers building multiple worksheets fast. But automated drafts still need a human check: AI tools can misplace an omnivore’s trophic level or miss a feeding relationship that’s specific to a regional ecosystem. Treat the auto-generated version as a starting point, not a final answer, especially if it’s going into a graded assignment.
If accuracy matters more than speed, build the list of organisms and their relationships yourself first, then use the tool purely for layout and arrows.