
What Does Segfaulting Mean, and How Do You Fix It?
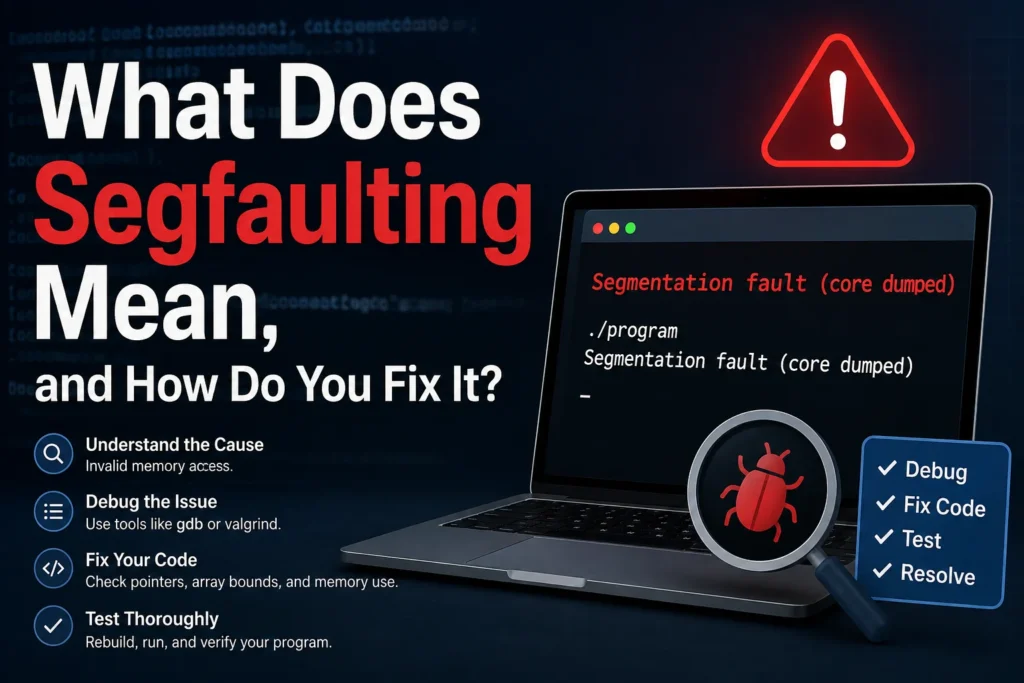
You ran your program. It printed a few lines, then died. No stack trace you can read, no helpful message, just… gone. If you’ve ever muttered, “Why is this segfaulting?” at 2 a.m., you’re in good company. It’s one of the most common crashes in C and C++, and honestly, once you know what to look for, most segfaults take minutes to track down, not hours.
What Is a Segfault? Exactly?
A segmentation fault, or segfault, happens when your program tries to read or write memory it doesn’t have permission to touch. The operating system’s memory management hardware catches the illegal access and kills the process before it can do any damage, sending it a signal called “SIGKILL.”
Think of your program’s memory like a hotel. Every process gets its own rooms, and the hotel security (your OS, backed by the CPU’s memory management unit) stops you the moment you try to walk into someone else’s room or a room that doesn’t exist yet. That’s the segfault. It’s not really a bug in the operating system; it’s the OS doing exactly what it’s supposed to do: protecting memory. It doesn’t trust your code to touch it safely.
This isn’t a new problem. The term dates back decades, tied to how early systems divided a program’s memory into segments, some writable, some not. Languages like C and C++ are especially prone to it because they hand you direct pointer access with almost no guardrails.
The Usual Suspects: What Actually Causes Segfaults
Nearly every segfault traces back to one of these five patterns.
Null pointer dereference. You declare a pointer, never point it at real memory, and then try to use it anyway.
c
int *ptr = NULL;
printf("%d", *ptr); // boom
Dereferencing an uninitialized pointer. Similar problem, sneakier. The pointer isn’t NULL; it’s just garbage, pointing at some random address left over in memory.
c
int *ptr;
*ptr = 5; // ptr was never assigned anywhere valid
Out-of-bounds array access. Reading or writing past the end (or before the start) of an array. This is the classic buffer overflow.
c
int arr[5];
arr[10] = 1; // there is no arr[10]
Use-after-free. You free a chunk of memory, then keep using the pointer as if it’s still valid. The memory might get reassigned to something else entirely by the time you touch it again.
c
int *ptr = malloc(sizeof(int));
free(ptr);
*ptr = 5; // ptr no longer belongs to you
Stack overflow. Usually from deep or infinite recursion, or from allocating a huge array on the stack instead of the heap. Each function call eats a bit of stack space, and eventually there’s none left.
Every one of these is really the same story with a different setup: your program asked for something the memory manager wasn’t going to hand over.
Reading the Crash Message
On Linux, a segfault usually shows up in one of two places. In your terminal, you’ll see something short: Segmentation fault (core dumped) that “core dumped” part matters; it means the system saved a snapshot of your program’s memory at the moment it died, which you can load into a debugger.
For more detail, check the kernel log with dmesg:
myprogram[12345]: segfault at 0 ip 00007f8a1b2c3d45 sp 00007ffd9e8f7a20 error 4The segfault at 0 tells you the memory address it tried to access (which almost always means a null pointer). This ip is the instruction pointer, roughly where in your code the crash happened.
How to Actually Debug One
Staring at “segfault at 0” isn’t going to tell you which line of code is guilty. You need a debugger.
Step 1: Compile with debug symbols. Add -g (and skip optimization with -O0) so the debugger can map machine addresses back to your actual source lines:
bash
gcc -g -O0 -o myprogram myprogram.cStep 2: Run it under GD. b. Load the program, run it, and let it crash inside the debugger:
bash
gdb ./myprogram
(gdb) run
(gdb) backtrace
backtrace prints the exact call stack at the moment of the crash, function by function, line by line. This is usually where you go, “Oh, THAT’S the problem.”
Step 3: Reach for Valgrind when gdb isn’t enough. Some bugs, especially use-after-free and out-of-bounds writes, don’t crash immediately. They corrupt memory quietly, and the program dies somewhere completely unrelated later on. Valgrind catches the bad access the instant it happens, not just when it finally causes a visible crash:
bash
valgrind --tool=memcheck ./myprogramStep 4: Consider AddressSanitizer for faster iteration. If you’re using GCC or Clang, compiling with it -fsanitize=address builds the checks directly into your binary. It’s faster than Valgrind for day-to-day debugging and gives you a clear report pointing at the exact line.
Fixing It, Cause by Cause
Once you know which pattern you’re dealing with, the fix is usually straightforward:
- Null or uninitialized pointers: always initialize pointers, either to a valid address or to `NULL`, and check for it
NULLbefore dereferencing. - Array bounds: double-check loop conditions (vs.
<is a classic off-by-one culprit), and consider bounds-checked containers likestd::vector::at()in C++ instead of raw arrays. - Use-after-free: set pointers to
NULLimmediately after freeing them, and consider smart pointers in C++ so the compiler manages the lifetime for you. - Stack overflow: check recursive functions for a solid base case, and move large arrays to the heap
mallocinstead of declaring them on the stack.
Preventing the Next One
Debugging tools catch problems after they happen. A few habits cut down how often you need them in the first place: initialize every pointer the moment you declare it; run Valgrind or AddressSanitizer as part of your normal test cycle rather than only after a crash; and if you have the option, reach for a memory-safe language or a library with bounds-checked containers for anything performance-critical that isn’t dictating raw pointers.
FAQ: Segfaulting Questions
Q: What’s the difference between a segfault and a stack overflow? A: A stack overflow is one specific cause of a segfault, running out of stack space. Not every segfault is a stack overflow, but every stack overflow shows up as one.
Q: Why does my program segfault only sometimes? A: This usually points to uninitialized memory or a use-after-free. The behavior depends on whatever garbage values happen to be sitting in memory at that moment, which can change between runs.
Q: Can a segfault happen in Python or Java? A: Rarely, and usually not from your own code directly. It’s more likely tied to a C extension, a native library, or the interpreter itself hitting a bug, since these languages manage memory for you.
Q: What does “core dumped” actually mean? A: It means the OS saved your program’s memory state at the moment of the crash to a file (usually named core), which you can load into gdb with gdb ./myprogram core to inspect exactly what happened.
Q: Is a segfault always a bug in my code? A: Almost always, yes. It can occasionally stem from a hardware memory problem or a corrupted build, but the overwhelming majority trace back to a pointer or memory-access mistake in the program itself.
The Bottom Line
A segfault looks cryptic, but it’s really your OS doing its job: stopping your program before an invalid memory access turns into something worse. Compile with debug symbols, pull up gdb’s backtrace, and lean on Valgrind or AddressSanitizer when the bug doesn’t show its face right away. Most of the time, you’ll find the exact line within a few minutes, not a few hours.