
A/B Testing: A Complete Guide to Running Your First Experiment
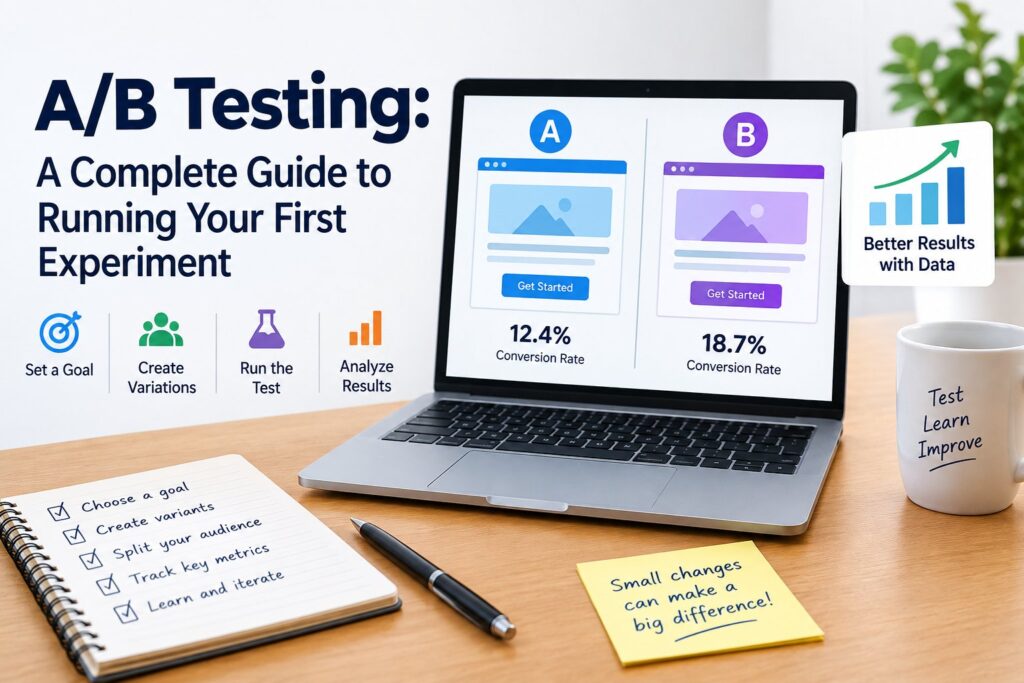
You change a button color. Conversions go up 12% the next day. Do you ship it?
Not yet. That 12% could be real, or it could be noise, a random blip that vanishes the moment you look away. This is exactly the problem A/B testing was built to solve, and it’s why teams at every scale, from two-person startups to companies running thousands of experiments a year, treat it as a core part of how they make decisions.
This guide walks through what A/B testing actually is, how to set one up correctly, how to read the results without fooling yourself, and where most people go wrong.
What Is A/B Testing?
A/B testing is a method of comparing two versions of something, a webpage, an email subject line, or an app screen, to see which one performs better on a specific goal. Version A is usually the current experience (the control). Version B includes one change (the variant). Traffic gets split between the two, and you measure which one wins on a metric you defined in advance, like sign-ups, clicks, or revenue per visitor.
It’s sometimes called split testing, though technically that term covers a slightly broader family of experiments, including tests with more than two variants (often labeled A/B/n tests).
The logic underneath A/B testing comes from randomized controlled trials, the same statistical framework used in clinical drug trials. Randomly assigning visitors to a group is what lets you claim the outcome was caused by your change, not by some other factor like a Tuesday traffic spike or a holiday sale.
Why It Matters
Opinions about what will “obviously” work are wrong more often than most teams expect. A redesign that looks better in a meeting can still tank conversions in production. A/B testing replaces guessing with evidence.
It also protects you from expensive mistakes. Rolling out a new checkout flow to 100% of users, only to discover two weeks later that it hurt revenue, is a costly way to learn something a properly run test would have shown you in days.
How A/B Testing Works, Step by Step
1. Start With a Hypothesis, Not a Hunch
A good hypothesis names the change, the expected effect, and the reason behind it. Something like, “Moving the price above the fold on product pages will increase the add-to-cart rate, because users currently have to scroll to see it before deciding.”
Skip this step and you’ll end up testing random ideas with no clear read on why something worked or failed.
2. Pick One Primary Metric
Choose the single number that determines whether the test wins or loses before you launch. Track secondary metrics too, but don’t let them override the primary one after the fact. This is where a lot of teams get into trouble: they run a test, see the primary metric is flat, then dig through ten other metrics until they find one that moved, and call that the win. That’s not a result. That’s cherry-picking.
3. Calculate Your Sample Size First
Before launch, estimate how many visitors and conversions you’ll need to detect a meaningful difference. This depends on your current conversion rate, the minimum lift you actually care about detecting, and your desired confidence level (95% is the common default). Free sample-size calculators from tools like Optimizely or Evan Miller’s calculator can do this math for you in seconds.
Skipping this step is one of the most common reasons tests produce misleading results. A test that ends too early, right when it happens to show a spike, is far more likely to be reporting noise than a real effect.
4. Run the Test for a Full Business Cycle
Run tests for at least one to two full weeks, covering weekday and weekend behavior, unless your traffic volume genuinely supports a shorter window. Stopping the moment you hit “statistical significance” on day two is a known trap. Early results fluctuate. Waiting out the full planned duration matters more than watching the dashboard.
5. Analyze With Statistical Rigor
Once the test finishes, look at your p-value and confidence interval, not just the headline “X% winner” number. A p-value under 0.05 (the standard threshold) suggests the difference probably isn’t random chance. But statistical significance and practical significance aren’t the same thing. According to Optimizely’s own documentation, practical significance is assessed separately from the raw statistical calculation, using the platform’s built-in statistical model. A 0.2% lift might clear the statistical bar and still not be worth the engineering time to ship.
6. Ship, Iterate, or Kill
Three outcomes: the variant wins and you roll it out, the variant loses and you learn something, or the result is inconclusive and you either extend the test or move on. All three are useful outcomes. An inconclusive test isn’t a failure; it just means the change wasn’t big enough to detect with your current traffic.
Common A/B Testing Mistakes
Peeking too early. Checking results daily and stopping as soon as you see a “win” inflates your false-positive rate dramatically. If you want to check results continuously without this problem, you need a testing tool that uses sequential statistical methods designed for that, not a simple fixed-sample calculation checked repeatedly.
Testing too many things at once. Change the button copy, the image, and the layout all in one variant, and you’ll never know which change actually drove the result.
Ignoring sample ratio mismatch. If your traffic split is supposed to be 50/50 but you’re actually seeing 55/45, something is broken in your setup, and your results can’t be trusted until it’s fixed.
Running underpowered tests. Low-traffic pages sometimes just don’t get enough visitors to reach a reliable conclusion in a reasonable time. In that case, test bigger, higher-impact changes rather than small tweaks that need enormous sample sizes to detect.
Confusing correlation with causation outside the test. A/B testing gives you causation because of random assignment. Simply comparing “before” and “after” numbers without a control group does not, since anything else could have changed in that window too.
What Can You A/B Test?
- Landing pages: headlines, hero images, CTA button color and copy, form length
- Pricing pages: layout, plan ordering, discount framing
- Email: subject lines, send times, preview text
- Checkout flows: number of steps, guest checkout options, trust badges
- Onboarding: tutorial length, default settings, welcome messaging
- App features: notification timing, navigation structure
Tools Commonly Used for A/B Testing
Teams typically reach for a dedicated experimentation platform (Optimizely, VWO, and similar tools handle traffic splitting, statistical analysis, and reporting), a product analytics suite with built-in experimentation (like Google Optimize’s successors or Statsig), or a custom in-house system built on a feature-flagging framework for teams with the engineering resources to maintain one.
For anyone without a statistics background, the practitioner reference Trustworthy Online Controlled Experiments by Kohavi, Tang, and Xu is widely cited across the experimentation community as a rigorous, practical foundation for running tests correctly at any scale.








1 thought on “A/B Testing: A Complete Guide to Running Your First Experiment”