
VanEck Semiconductor ETF (SMH): What It Holds and Costs
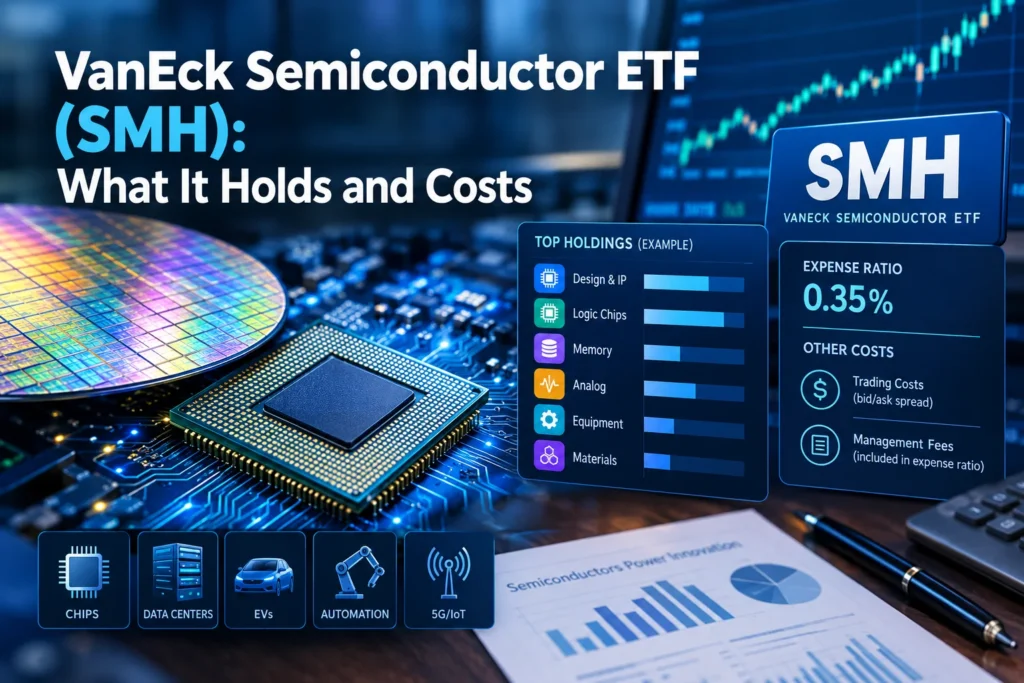
Chip stocks have produced some eye-popping numbers lately, and the VanEck Semiconductor ETF (ticker SMH) is one of the easiest ways to own a slice of them. One fund, no stock picking. Sounds simple. The catch is that this ETF is far more concentrated than most people expect, and a single company makes up nearly a quarter of it.
This guide covers what the fund holds, what it costs, how it has performed, where it can hurt, and how it compares with SOXX and SOXQ. Figures come from the issuer’s August 31, 2026 fact sheet, so confirm current numbers before you act.
What Is the VanEck Semiconductor ETF?
SMH is a passively managed fund that copies the MVIS US Listed Semiconductor 25 Index. The index is meant to track companies that produce semiconductors and the equipment used to make them. It started trading on December 20, 2011, lists on Nasdaq, and held roughly $67.8 billion in assets at the end of August.
Size helps in a practical way. Heavily traded funds usually have tight spreads, so you lose less to trading friction when you buy or sell.
No manager is choosing stocks here. The index sets the list, and the fund follows it. One small trap: VanEck runs a separate fabless-chip fund too, so check that the ticker reads SMH before placing an order.
What Does SMH Hold?
The fund owned 26 positions at the end of August, and its ten largest made up 71.76% of assets. The biggest six:
| Holding | Weight |
|---|---|
| Nvidia | 22.82% |
| Taiwan Semiconductor (TSMC) | 9.54% |
| Broadcom | 6.10% |
| Micron | 5.57% |
| AMD | 5.39% |
| ASML | 5.07% |
By location, the U.S. accounts for 82.32%, Taiwan 9.54%, and the Netherlands 6.15%, with information technology covering 99.9% of the portfolio.
Twenty-six names sound diversified. It isn’t, really. If Nvidia stumbles, roughly 23 cents of every dollar in the fund feels it directly, and the next several holdings often move the same way at the same time.
How Much Does SMH Cost?
The expense ratio is 0.35%, about $35 a year on every $10,000 invested. VanEck’s fee covers most running costs, but trading commissions, taxes, and a few other items sit outside it.
Income is thin. The 30-day SEC yield was 0.16%, so you’d be buying for price growth, not payouts. The price-to-earnings ratio was 37.21, a rich multiple that assumes plenty of future growth.
How Has SMH Performed?
Average annual NAV returns through August 31, 2026, were 92.36% over one year, 53.42% over three, 33.47% over five, and 33.84% over ten. Year to date it was up 54.56%, yet the three-month figure was down 7.03%. Over the trailing 52 weeks, NAV ranged from $286.43 to $668.69.
I’d read a 92% year as a warning about volatility, not a forecast. Numbers like that rarely repeat, and the same fund can fall hard. Past results don’t promise future ones, and VanEck says so on its own fact sheet.
What Are the Risks?
Four stand out.
- Concentration. The top ten hold nearly 72% of the fund, and Nvidia alone holds almost 23%.
- Boom-and-bust demand. Chipmakers move in cycles. Heavy AI data center spending has lifted the group, and a slowdown could hit it just as hard.
- Geopolitics. Taiwan and the Netherlands’ exposure ties results to trade rules and export limits that governments can change quickly.
- One sector. Nearly everything is technology, so nothing else cushions a bad stretch.
VanEck’s own risk list also names non-diversification, foreign issuers, and index tracking issues. Read the prospectus before buying.
SMH vs SOXX vs SOXQ
| SMH | SOXX | SOXQ | |
|---|---|---|---|
| Issuer | VanEck | iShares | Invesco |
| Index | MVIS US Listed Semiconductor 25 | ICE Semiconductor | PHLX Semiconductor Sector |
| Holdings | 26 | 30 | ~30 |
| Fee | 0.35% | 0.35%* | 0.19%* |
| Weighting | Pure market cap | Capped | Index-based |
*Sources disagree slightly. One lists SOXX at 0.33% and SOXQ at 0.10%. Check each issuer’s page.
SMH and SOXX cost about the same, so the real difference is weighting. SOXX caps single positions, which keeps its leaders close together, with AMD, Nvidia, and Micron each near 8%.
That design mattered in 2026. Through August 4, SOXX was up 80.24% year-to-date versus 59.86% for SMH, but over five years SMH’s 339.48% beat SOXX’s 261.59%. Neither wins every year. It depends on whether leadership is narrow or broad.
SOXQ is the budget option. The etf.com comparison points to its 0.19% fee for cost-conscious investors.
Who Might Consider SMH?
This isn’t a recommendation. Some analysts describe these funds as satellite holdings rather than core ones. That fits: a small piece beside a broad index fund.
Three questions help. Do you already own Nvidia through an S&P 500 fund? Could you sit through a drop of 30% or more without selling? Is your horizon five years or longer? If any answer is shaky, a smaller position may suit you better.
FAQ: VanEck Semiconductor ETF Questions
Q: What does SMH invest in?
A: Mostly U.S.-listed chip designers, makers, and equipment suppliers, plus a few foreign names like TSMC and ASML.
Q: What is SMH’s expense ratio?
A: 0.35%, or about $35 a year per $10,000.
Q: Does SMH pay dividends?
A: Barely. The 30-day SEC yield was 0.16%.
Q: How many stocks does SMH hold?
A: 26 at the end of August 2026.
Q: Is SMH good for beginners?
A: It’s easy to buy but volatile and concentrated. Many beginners start with a broad fund and add something like this in small amounts.
Q: Can SMH lose money?
A: Yes. It’s a single-sector equity fund, and your principal can fall.
Q: How does SMH differ from SOXX?
A: SMH weights by size, so Nvidia dominates. SOXX caps weights, which spreads exposure more evenly.
The Bottom Line
The VanEck Semiconductor ETF gives you cheap, liquid access to the chip industry, but it comes with heavy reliance on a few giants. Weigh the fee, the concentration, and your own tolerance for swings. This article is educational, not financial advice, and it isn’t a substitute for talking with a licensed advisor.






1 thought on “VanEck Semiconductor ETF (SMH): What It Holds and Costs”