
BIZD Explained: What the VanEck BDC Income ETF Holds
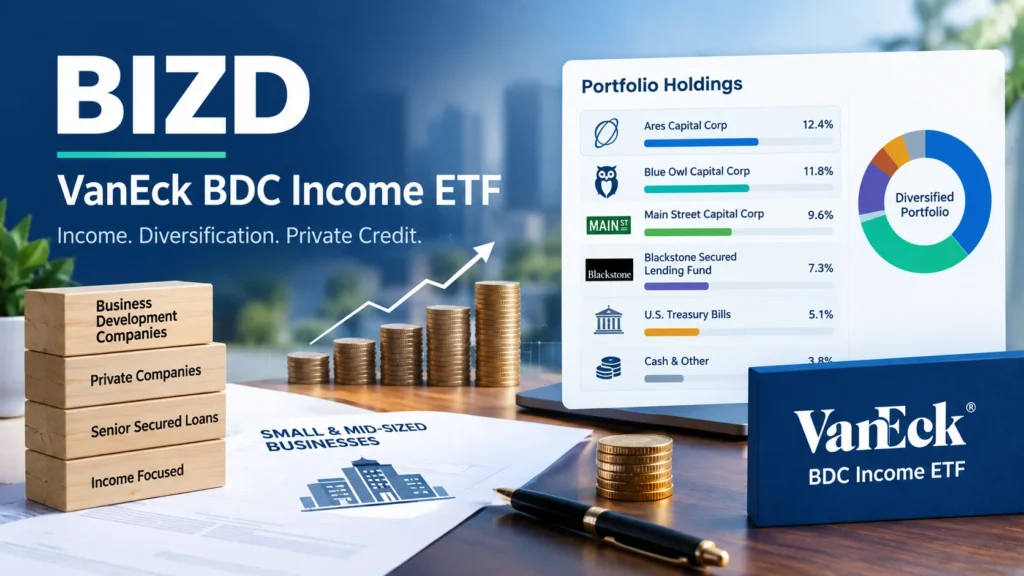
The VanEck BDC Income ETF (BIZD) buys shares of publicly traded business development companies (BDCs), which lend to small and midsize private firms. Its yield looks big, but three different yield figures and a 9.69% expense ratio confuse a lot of readers. Here’s what each number means, based on VanEck’s own data as of September 29, 2026.
What is the VanEck BDC Income ETF?
Congress created BDCs so smaller domestic companies could reach capital more easily, a purpose the SEC has described in its own releases. This fund packages that idea for a regular brokerage account. It follows the MVIS US Business Development Companies Index, and the fund page reports 35 holdings and about $1.56 billion in net assets. Ares Capital (ARCC) leads at 13.69%, with Main Street Capital and Blue Owl Capital Corp near 5% each.
One reason these lenders’ yields run high: they must pass along roughly 90% of taxable income to shareholders. That’s the rule that keeps their corporate tax bill minimal.
Why the 9.69% expense ratio looks worse than it is
Here’s the number that trips people up. The fund page lists a 9.69% total expense ratio, yet the management fee is only 0.40%. Both figures are right. In its May 2026 disclosure, the issuer splits the total into 0.42% of direct costs and 9.27% of acquired fund fees and expenses (AFFEs).
Those indirect costs belong to the BDCs themselves: management fees, incentive fees, and operating expenses. They’re already reflected in each BDC’s share price, so the ETF never bills you for them. A 2006 SEC rule just requires funds that hold other funds to show them.
Does that make cost irrelevant? No. Those fees still drag on returns, and some BDC incentive fees get paid even when portfolio values fall. But setting 9.69% next to a plain stock ETF’s fee overstates the gap.
What’s actually inside the fund?
Open the holdings file, and something looks odd. Besides 30 BDC stocks, there are two U.S. Treasury bills totaling roughly 39% of net assets, plus two total return swaps on the BDC index with about $600 million in notional value. A swap is a contract that delivers an index’s return without owning every share directly.
The fund’s own disclosure lists derivatives and liquidity risk related to swap agreements among its risks, so the prospectus section on them deserves a careful read. Most quote pages skip this entirely.
Three yields, one fund
The fund reports a 30-day SEC yield of 9.47%, a 12-month yield of 11.74%, and a distribution yield of 7.37%. Why the spread? The SEC figure looks at the latest 30 days after expenses. The 12-month number adds up a full year of payouts. The distribution yield typically annualizes the most recent payment.
Payouts arrive quarterly, and the sponsor says swings from one quarter to the next don’t necessarily mean the underlying lenders earn less. Treat any single yield figure as a snapshot.
Risks worth weighing
High yield isn’t free money. Through August 31, 2026, the fund’s one-year NAV return was -6.08%, and Yahoo Finance data shows a -4.95% total return for 2025. Income can shrink too: Ares Capital’s portfolio yield slid from 11.1% to 10.3% over a year amid falling rates.
Rates deserve a closer look. Most BDC loans float, so payments rise and fall with benchmark rates such as SOFR. That helped income when rates climbed. When benchmark rates fall, the reverse can happen, and dividend coverage gets tighter.
Other risks: borrowing inside the BDCs magnifies losses, credit quality can slip, and concentration matters, since ARCC alone is nearly 14% of assets. The sponsor also flags small- and mid-cap exposure and return of capital among the risks.
How to check the numbers yourself
You don’t need to trust any article, including this one. Three VanEck documents answer most questions. The daily holdings file shows the swaps and Treasury bills. The AFFE explainer breaks down the 9.69%. The NAV and premium/discount history show whether shares trade above or below their underlying value. For the BDC rules themselves, the SEC’s investor education pages and the fund’s prospectus are the places to start.
FAQ: VanEck BDC Income ETF (BIZD)
Q: What does BIZD invest in?
A: Mostly U.S.-listed BDC stocks, plus Treasury bills and swaps tied to the BDC index.
Q: How often does it pay distributions?
A: Quarterly. StockAnalysis showed July 1, 2026, as the latest ex-dividend date as of September 28.
Q: Do I pay the 9.69% expense ratio directly?
A: No. About 9.27% of it is indirect, embedded in BDC share prices. The direct cost is roughly 0.42%.
Q: Is BIZD diversified?
A: It holds 30 BDC stocks, but ARCC is about 14% of net assets, and the top four total roughly 29%.
Q: Is BIZD a good investment?
A: That depends on your goals, risk tolerance, and tax situation. This article is information, not advice; a licensed advisor can help.
The bottom line
BIZD offers one-ticket access to listed private-credit lenders, with a high yield and real risks. The 9.69% figure is mostly an accounting disclosure rather than a bill, but the swaps, concentration, and rate sensitivity deserve attention. Check the current holdings file and prospectus on VanEck’s site before drawing conclusions, since every figure here changes daily.







1 thought on “BIZD Explained: What the VanEck BDC Income ETF Holds”